Saturday, June 11, 2011

Extending Value Stream Mapping Notation For Value Creation Networks

photo 5(3)..

Extending Value Stream Mapping Notation For Value Creation Networks

When I first started reading about and using lean in a context for helping improve software delivery performance, the tools I used were either classic lean techniques (e.g. value Stream mapping) or agile practices in a slightly rebranded way (i.e. my scrum board is a kanban). This was in large part due to the fact that most of the literature I was exposed to was material straight out of the manufacturing world, or the various Poppendick books based on lean software delivery, which are in my opinion great reads, but primarily focused on explaining why agile works using a lean vocabulary, rather than providing ideas around how lean can be used to extend some of the practices already in agile.

Over the last several years I’ve had the opportunity to interact with some great minds within the lean systems and software community. Obvious names like David J. Anderson, Don Reinersten, and Alan Shalloway come to mind, but more importantly the general discussion around the lean for systems and software community has really reshaped the way I think about building systems of work to support the delivery of high-quality software.

One tool that has fallen out of favor with a significant number of the community is value stream mapping. Interestingly, this is a tool I continually reach for when trying to define either the current state of the software delivery process, or to help various stakeholders come up with what the various handoffs, activities, and order of work should be for future project, future program, or to support a future organizational design. That being said, I tend to agree with those in the community that feel that the value stream. mapping notation as it exists right now contains some significant flaws. The notation is really meant for stable, serial/linear processes. There is no real way to describe different strategies to handle variability, or the non-homogenous nature of the work entering the system.

I’ve since come up with a notation to extend value stream. mapping with some simple notations that allow me to model what I perceive to be a value creation network. The notation is certainly in its alpha form, I’m sure I’ve missed a whole bunch of concepts. I’m sure they’ll be others out there that also think that the notation still leads to defining processes that are to serial in nature, I’m hoping to post some example diagrams showing popular methods and approaches that are nonlinear in nature (e.g. extreme programming) and I’ll tweak the notation as I go.

If anybody wants a stencil that I created for Omnigraffle, you can find it here. This will allow you to leverage the value creation network notation to build your own diagrams using your Mac or iPad.

Classical Value Stream Mapping Notation

the icons below represent classical value Stream mapping. This should be familiar to anybody that has done value Stream mapping before, I have limited myself to only a couple of essential artifacts. key

photo 3(3)

Explicit Activity that needs to be completed for value to be created

photo 4

one of my favorites, the need for multiple activities to be completed by a co-located team, in order to deliver value


photo(2)

of course activities need people to get things done, color-coded for different specialties.

photo 1

When people work, artifacts are created, and inventory builds up (unfortunately).

Push

Ye old push model. Build a bunch of stuff, when it’s finished push it to the next team, hopefully they have capacity because your top-down upfront plan was so perfect :-)

photo 1(5)

or we could always allow downstream teams to pull work when they have capacity to do so, triggering that an upstream team can start work

photo 5(2)

people don’t just move inventory around, they also pass along information, this is probably even more critical to knowledge work in this for manufacturing

Extending Value Stream Mapping to Handle Non-Homogenous Work

Of course one big difference between knowledge work in manufacturing is the number of different sources of work, and how the risk, size, and knowledge required to do the work can change dynamically. Work also can break up and merge repetitively, and work can be be completed in parallel.

Here are some notations that I’ve used to try to capture some of these concepts

idea

All knowledge work stems from a good idea

photo 4(2)photo 4(2)photo 4(2)

hopefully most work delivers business value, work will often come in different sizes...

photo 4(3)

occasionally there will be emergencies, let’s hope that these emergencies are small in size

photo 5(7)photo 5(7)photo 5(7)
business reality will dictate that some work will have a fixed date, this also varies in size quite often

photo 4(6)photo 4(6)photo 4(6)

any optimal system should also spend a certain portion of its work on fine-tuning/optimizing itself, keeping technologies up to date, rThis Work Can Get Really Big (and Platform Upgrades)latform upgrades)

photo 3(6)

work can become blocked, which requires management intervention

improvement

hopefully do system will also generate ideas on how to improve the work , not just generate work itself

photo 3(4)

knowledge work will frequently start as a very large concept, scatter into finer grained projects, and further scatter into releases/stories/features/use cases/etc. so that it can be completed in small atomic units

photo 2(4)

likewise knowledge work will aggregate from discrete specific units into something of business value, think of how individual user stories can merge into a business release that the customer wants

photo 5(9)

describing worked in terms of features has become increasingly popular in the lean/kanban world

photo 4(8)

a minimum marketable feature set represents the smallest collection of features that could be deployed as a unit giving meaningful business value

Notations for Knowledge Worker Interaction Patterns

Here are some patterns that I’ve observed using various different delivery models, with some thrown in from my readings of kanban and flow
photo 3(5)

an agile favorite, let’s get a dedicated team, hopefully cross functional, definitely co-located, and have that teams swarm on the various activities necessary to create value

photo 4(7)

teams can be formed as necessary from a greater pool of similarly skilled resources

pool

there are situations (and I will argue this to death with the agile purists folks) where a cross functional team can leverage the help of external specialists for specific tasks. Think of security/vulnerability specialists, legacy subject matter experts, or masters in a very esoteric business domain. In this situation teams can pull from a pool of specialist resources for the duration require, after which the specialists go back into the pool. this is a great pattern to handle need for resources that do not have enough stable demand within any specific team to be a full-time member of that team, book still need to work closely enough at that team t that creating a downstream specialist team doesn’t make sense

photo 5(4)

a certain portion of the work requires differentiated knowledge because of business or application concerns, or there is a reasonable amount of variability in demand across numerous business channels. It may make sense to create channel specific entry points for each business client, but to back the people representing the multiple entry points with a common pool that possesses common skill sets necessary to handle the different channels of demand. This only makes sense if the multiple entry points are supported by some kind of common/cross cutting set of skills

Notation That Described Various Strategies to Handle Variability in Demand

Again reading the works of Reinersten and Anderson have helped me to articulate many of the strategies that we knowledge workers use to handle variability, having these explicitly described I think is very helpful for all the obvious reasons

photo 5(8)

if there’s one thing that lean and agile thinking teaches us, it’s not to underestimate the value of slack time. Smart agile teams reserve capacity explicitly by limiting how many hours in the day are reserved to code. The greater the cost of delay is for a particular piece of work, the more critical it is that capacity be reserved to handle variability

photo 2(3)

if work is coming into a system with various risk/priority profiles, then it makes sense to have an understanding of this demand and to load balance it. This will allow knowledge workers to drop low priority work for higher priority work whenever it comes into the system. I really like this pattern as it allows knowledge workers to reserve capacity for high priority work by making themselves busy doing lower priority work that is still essential for improvA ent

photo 1(2)

A T shape resource is a resource who takes the time to make sure he is competent in both upstream and downstream processes. Not he gets more senior the T not only gets better at his core responsibilities , he also makes sure that he can contribute in other areas as well. Creating these kinds of people cost money, and causes them to be less effective on their core capability than if they practiced at their primary concern . This however is a worthwhile economic trade-off in almost all aspects of knowledge work, due to the high degree of variability. It is very hard to predict the fact amount of work required for each skill set, requiring more senior people to have a balanced set of skills is one of the best strategies out there for dealing with fluctuations demand.
photo 1

supporting 2 or more different teams with a part-time expert is another excellent strategy for handling variability. The part-time expert spends enough time with two teams to understand the context of both to make himself useful as a part timer. When one of the teams faces a spike in demand, the part timer switches to full time (plus overtime if necessary) and significantly increases the teens capacity until things get under control

Some Other Symbols that I wasn’t sure How to Categorize

photo 2(5)

unfortunately some work has to get done through meetings, would it be nice if this is never so...

photo 2

and the evil stage gate never seems to completely go away...

photo 1(3)

decision rules are great ways for constraining the environment so that not every decision needs to be made over and over again. Of course great care needs to be taken that decision rules do not become inflexible and permanent. I I find that a organization need to be relatively sophisticated and mature to approach this concept in an appropriate way.

photo 3photo 4

Some of the best thinking from the agile world revolves around how to create automatic signaling that kicks off a automated activity based on certain events, think of continuous integration, test driven development and the like

here is a picture of the entire stencil

........

photo 5(3)..

Saturday, April 9, 2011

Optimizing Your Delivery Approach Based on Market Risk


Very often I get into conversations with clients and colleagues around how technology X or approach X is going to make product delivery both faster and cheaper at the same time. I'm sure I'm not the only person who's read a marketing blurb around how SOA is going to both increase agility and reduce cost. The major issue I have with these statements is that creating a delivery system of work that is optimized towards cost tends to look very different from a system of work that is optimized towards speed. Many of my clients want help in optimizing both, an interesting exercise that I have them do is determine the kind of business that their IT organization is trying to support. One way to categorize an organizations delivery objectives is to use an innovation scale, where True Innovator is at the top of the scale, and delivering Commodities/Table Stakes requirements is at the bottom of the scale.
While only a small number of organizations can be considered True Innovators, many find themselves in the First Mover or Fast Follower space. When supporting this kind of business, Cost Of Delay is considered to be relatively high, when compared to the Cost of the Work. In other words it makes more sense to increase capacity in order to deliver faster. People in the lean /kanban space will recognize increasing capacity as another way of limiting WIP to low levels. Lower WIP implies more collaboration, a more streamlined processes and an agile approach. Handling the higher variability in this domain also requires less attention to centralized governance and standardized processes. This approach has the effect of delivering much faster but causes cost to go up.
Other organizations support requirements for much more stable business problem domains, and are often concerned with delivering cheaper, cutting costs, and providing table stake type requirements to their customers. In this scenario Cost of Delay is much lower relative to the Cost of the Work. In this case utilization should be much higher, and spare capacity should be much lower. Highly specialized resources, standardized processes, and economies of scale are used to drive down costs. Of course this approach causes delivery cycle times to take longer. Highly centralized governance required for standardized approaches slows things down, so do all the hand also required because of specialized resources.
One interesting note is that most clients that I've worked with make the error of optimizing towards trying to cut costs thinking that this will also allow them to deliver faster. Most people I have worked with also underestimate the inherent variability in the problem space that they are working, using a new technology to solve a commodity business problem also counts as innovative use, and the laws of using lower WIP apply.
It's interesting to note that highly valuable, innovative, first market features fall squarely in the domain of agile teams, working in small increments with spare capacity to manage variability in the problem space. Commodity problems using commodity technologies fall more comfortably in the waterfall style approach. That being said, IMHO I don't believe that even package installation (e.g. SAP) with a moderate amount of vanilla configuration falls into this commodity space. If there is a requirement to contextualize technology to a customer's environment then I don't believe the product should be treated as a commodity, and some element of lowering WIP, and leveraging feedback should apply.

Tuesday, March 29, 2011

Using Planning PokerTo Increase Collaboration and Gain Consensus

One of the interesting aspects of Kanban is its attitude towards estimation. There are some in the community of kanban practitioners believe that estimation is an unnecessary activity.

I asked for clarification during a recent conversation with David J. Anderson, and his opinion was that estimating was a good thing to do, provided the following 2 points:
  1. estimates could be created quickly and cheaply
  2. estimates produced were of high-quality
Recently, we have been supplementing what started off as a largely "pure" Kanban project with more and more agile style practices. One of these which is getting great traction is planning poker, a collaborative estimation game.

Our rationale for doing planning poker actually has very little to do with getting good estimates. My colleague, Alexis Hui and I were actually a lot more concerned with getting more team buy-in towards commitments made, collaboration on what the solution should look like before delivery started, and better consensus between architects and developers.

What is interesting is that we limited the estimation range to be between 1 and 13, if something could not fall within that range we needed to break it up or do more research before completing the estimate. Prior to this meeting, I had already provided estimates to the executive sponsor where every story simply equaled 8 days each. As each story was estimated during time poker, the numbers typically were either 5 or 8, and only occasionally did they fall outside that range.

The total estimated number created by the planning poker sessions were almost identical to the ones were all stories equaled 8. So was the estimation session a waste of time? Absolutely not, the one thing that I've noticed about collaborative estimating games, is that they generate a lot of valuable information, often a lot more valuable information than generic modeling sessions. There is something about thinking about how long something takes that causes the mind to shift to a very practical and pragmatic solution. When a cross functional team takes part in this exercise the entire team gets quick alignment around not only what should be done, but how it should be done.

So I'm going to add a third point for when to estimate as an additive to the above 2:

3. When you want to quickly generate information and gain agreement on how to proceed

below are some pictures from the planning poker session:

Sunday, March 27, 2011

Using Cost of Delay Functions to Prioritize Product Delivery

Cost of Delay

In many "agile" projects I’ve been a part of my strategy was to break off specific functions / use case / stories / whatever and delivery them mostly whole one piece at a time. IE in iteration 1 go deliver order entry functionality, in iteration 2 go deliver product fulfillment.

Typical Iterative Approach
While this approach help keep delivery efficient by breaking up work into smaller units, it does nothing to help business agility. When delivery a product an agile approach is to look at the product from a truly incremental perspective. What is the minimum that one can deliver right now that would meet some basic objectives of the product, what are the next set that would make the product a little better, and so on until I get that ideal product, one releasable piece at a time.
photo 5
Using this approach means it’s not enough for teams to develop code each iterations that is production worthy. Rather the entire organization needs to think about releasing products to the market in increments.

For this to work the business needs to train them selves to stop asking if they can get the world a year from now, but if they can get a small piece of the world next week.

A colleague of mine, Alexis Hui came up with a very innovative way to manage this approach on a project that we were running. The approach was to extend our Kanban board with a capability and theme map, illustrated below.

Theme Oriented Map
The whiteboard was divided into sections based on major capabilities that the product had to meet. Capabilities were further broken up into major project themes that has numerous theme "attributes". Each attribute could be thought up as a feature that could be revisited numerous times over the lifecyle of the project. Each time the attribute required new work a story would be tagged with the theme and attribute.

As an example the provisioning handset capability might have a theme for voice mail that had an attribute for activation and one for de-activation. An initial story would describe the work necessary to provision voice mail on a cell phone with a very simple set of features, a later story would describe fancier features like visual voice mail.

Each theme/attribute set would act as a persistent queue, where stories could be placed.

We then used a concept known as a Cost of Delay Function to prioritize stories. Think of a Cost Of Delay Function as a simple way to profile the impact of not doing a story on the business, or in this case the project. COD, also known as Opportunity Cost, is often graphed as a line showing the relationship between impact vs time, the steeper the angle of the line, the worse the impact is over time. COD can represent financial, political, moral, or other impact that could adversely impact the organization.

While it can be very hard for an organization to know the exact impact over time for not doing a particular work item, one is frequently able to allocate the COD into a broad category or profile. When using COD I recommend using color, or annotations to tag work on a Kanban board to identify it’s COD profile.

Cost of Delay
Because our project was all about launching a new product, we decided to base our COD profiles loosely on market risk.

Orange tickets represented work items that were necessary to launch the most basic version of the product, the COD on this is represented as a straight vertical line. If we did not deliver these by the target date of the first release then the project would be deemed a failure. These were necessary to enter the market.

Beige tickets represented a second pass at the orange tickets, taking mostly manual bare boned functions and automating them, adding better error handling, and other work to make sure that a fully operational product would support more than a limited pilot. This COD was illustrated as an incremental line starting right way, we were losing money everyday these weren’t implemented, and things would get worse the longer they weren’t delivered. These tickets were necessary to support market growth.

Green tickets represented high end features like customer self care, power tools, customizations features, and market grabbing functions such as keeping a phone number when transferring to the new plan. COD here was illustrated much like the beige tickets, but with a delay before incurring losses, and a more pronounced curve on the line, we didn’t need these features right away, but they were quite valuable later on. These tickets were necessary to steal market share from competitors.

Blue tickets represented longer term investments. Completing a blue ticket did not result in a noticeable business impact. Rather work quality would improve. Architecture work, educating the team on agile practices, refactoring, technical docs, were all profiled as blue tickets. These tickets had a straight horizontal line with a slight upward slope to it, immediate value was not obvious to the business, but not doing them would result in downstream pain. These tickets were necessary to ensure that the IT team could continue to support other market needs at a reasonable pace and price.
Theme Oriented Map 2
The above diagrams shows stories colored by COD. One can easily see which capabilities are more critical to earlier stages of development, and which ones should be done later. It should be noted that prioritization is not as simple as choosing one color, than choosing another, than another. Different business and different projects will choose a different allocation of COD profile tickets depending upon where they are in the product life cycle.

COD allocations are also dependent on the nature of the business they are in, for example start ups will likely face more extinction level events than blue chips, and have more "warm" colored tickets in flight to respond to these events.

It was typical using this approach to revisit an attribute several times. The first story for an attribute may be a blue ticket involving a spike, POC, or actual design. Subsequent stories for the attribute could involve one more orange and beige tickets, depending on the desire for a mostly manual solution or full automation of a component out of the gate. Later stories would often be a series of blue and green tickets necessary to POC new technologies and implement new functionality necessary to support some high end feature.

The one common theme here is that the simple use of color can be used to convey an awful lot of information with deep meaning to the business, helping delivery support real agility.

Wednesday, March 23, 2011

Why co-located team rooms are important

One of the most valuable aspects of co-locating a team in a common area is that it eliminates a lot of the "us vs them" mentality that tends to happen when team members are working in different locations. I have observed that it is a fairly natural occurrence in teams that are distributed to be less collaborative and helpful to each other if they are separated by distance.

For example, here's an interesting email conversation trail from a previous project between two distributed teams (in the same building but different floors and opposite ends of the building):


Email 1 from Debugging Developer:

Hi Developer B,

I was wondering if processing transaction A is supposed to work for ActionTest. I’m using the following data with an error of “failed to execute called process”, can you advise, thanks.


Data used:

Some complex XML message      
     
Response email from Developer A:

You sent a transaction per below.  The changes were not deployed on the tActionTest.  I will have to rebuild that deployable.  (It was deployed for the end-to-end process, not the test webservice.)

I can't find your request in the logs to check the error.

Thanks,

Developer A


Email 2 from Debugging Developer:

Ok so I guess it shouldn’t work until its been rebuilt right?

Response email  from Developer A:

Yes, I forgot about deploying the test service because I was focusing on the integration model. 


Developer X just deployed the most recent ProcessingComponent changes on the test service, and this included my code updates, so the service should work now. 


ProcessTransactionService fails this sample request as per below:


  < Failed OrderDetail(s) : 9084694735  ErrServiceQueryFail
   updateSubscriber_ERROR-1553

and more complex XML/>


Thanks,
Developer A


Email 3 from Debugging Developer:

Great, yeah I see that error now, middleware integration admin logs for ActionTest still times out. I’m not sure why the error occurs, is there any way that I can dig deeper? 

Response email from Developer A:

Look at the ProcessTransactionService.

Email 4 from Debugging Developer:

Any idea what “Failed Tranasaction(s) : 1234567 (error=-65608)” means? I understand that transactions with FDR of 232 and IBC of 456 must be used, so I specified the following request:

Some complex XML...
Response email from Developer A:

Did you intend to address this to me?  I don't know this.  AquaLogicBus is calling the ProcessTransactionService (java).  This error is returned from the ProcessTransactionService.


Thanks,
Developer A


Email 5 from Debugging Developer:

Yeah, I just thought you might know, Developer B might have a better idea.

Developer B, I’m sending the request below to AquaLogicBus and get the error: “Failed Tranasaction(s) : 1234567 (error=-65608)”, tn I used is:  ,
What rules are there for Transaction A?

Thanks.

Response email from Developer B:

But the error is self descriptive...the transaction is not unqiue i.e. processed...you cannot process the transaction twice/more in ProcessTransactionService.

Email 6 from Debugging Developer:

I have yet to trained myself to understand (error=-65608)
I’ll try more numbers even though numbers such as 1234567 and more also do not work for Transaction A, these numbers have not been processed since they were verified by GetStatus of the ProcessTransactionService returning ErrGetStatus.

After a bit more back and forth, finally the Debugging Developer discovered the root cause of the problem. In total, this took 6 hours and ~10 emails. Think this is a good example of the communication effectiveness Alistair Cockburn talks about:


Friday, March 11, 2011

Kanban - Add colour to your work to help the team focus

One of the aspects I find valuable with Kanban, is the work visualization. However, sometimes I find that the work is so chaotic/iterative and collaborative in some portions of the process that the standard columns and rows in the kanban board don't provide enough flexibility. You'll see this when you have one work item that requires separate but related work from multiple team members due to their specialization.

 In these situations, I avoid trying to fit the highly iterative work into columns and rows, and collapse them together into a single step on the board. The problem I run into when I do that, is it becomes hard for the team to figure out who is working on what and what work remains to be done on the work item.

To solve this problem, I apply colour to the work using coloured stickies that I "tag" on work items to denote what's be done on each particular work item.


In this example, the team pulls a work item (user story) into the "Create FitNesse Template and Automate" column of the board. To move an item through this part of the delivery process, requires the team to define detailed acceptance criteria in the language of the domain model, get it into a FitNesse page, and then automate the tests. This requires at least three specialized skillsets, a business analyst who understands the requirements that can help define the acceptance criteria, a developer that can verify that the acceptance criteria can be automated and develop the automation code if needed (fixtures etc.) and an architect/product owner that can review the acceptance criteria. Also, the work is not necessarily sequential and may be done in parallel or require multiple iterations.

To help visualize the work for the team, we applied coloured stickies that are tagged to each work item once something has been completed on it. For example, if the FitNesse template is done and data is defined than we tag it with a red sticky. If automation is completed / not required than it is tagged with a blue sticky and upon review from the architect/product owner we tag it as yellow.

A neat result of this process, is that each team member can immediately tell what item they should be working on. The business analyst just needs to look for work items that are missing red tags, which is a signal for them work. Similarly, blue for developers and yellow for the architects/product owners. 

Saturday, December 11, 2010

Using Standardized Work Types To Enable a Measurable, Continually Improving System of Work


Readers of this blog can attest that I am a big fan of many of the innovations and new thinking that’s come out of the Lean for Systems and Software Community. One of the more interesting innovations that I have been injecting into a variety of my client commitments has been the notion of tagging all work according to a finite set of possible work types. Once this work type categorization has been done then work can be tracked, measure, and managed according to the unique features of that type. This approach provides a healthy balance between treating all software delivery work as being completely unique, requiring completely different process and skills, and treating all software delivery work as being the same. Frequently my clients get tripped up around when to standardize, and when not to, how much common process is a good thing, and how much gets in the way. I found that one of the most effective ways of dealing with this issue is to create one or more work types that match the context of a particular software delivery environment, variation of approach can then be used to support the unique context of these different categories of work carried
Defining work according to A finite set of standardized work types allows management to measure, manage & improve highly variable work
Capturing meaningful metrics is challenging, work across context aren’t always comparable
The first big benefit of tagging work according to a finite set of work categories is that it supports the scalability of a measurable system of work. Frequently organizations fall into the trap of trying to capture and compare metrics across a variety of "work" contexts. These work contexts include
  • unique solution platform
    solution types (business intelligence, SOA, Web applications, ERP, etc.)
  • Risk/Cost of Delay (long-term investment, emergencies, incremental value, etc.)
  • size/complexity
  • team capability/geography/culture
  • value (new business feature versus change request/defect)
  • etc.
the problem with capturing metrics is that work across contexts are not really comparable, comparing the estimation accuracy, throughput, or cycle time of business intelligence work to Web application work doesn’t really give me any meaningful data. The challenge is that software delivery is inherently highly variable, a multitude of factors make work different, and obscure meaningful analysis. The obvious approach, is to measure each work item according to each unique combination of "work categorization" actors. Unfortunately while this approach will result in accurate measurements, it really doesn’t scale. This approach ends up creating a complex multidimensional dashboard, being very hard to read and very hard to maintain.
metrics_work_variability
Create standard work types based on the most common combination of work attributes
another approach, one that I am recommending and implementing with a number of my clients is to spend some time analyzing both current and future demand with an eye towards categorizing this demand into a reasonable and manageable list of work categorization types. Not every type of work needs to make it into a work type, my recommendation is to start with the most prevalent work, categorized work into one or more of these types, and then start "tagging" any new work according to one of these types. Work performance measurements can then be associated with each of these types.
Each work type is an expression of a particular combination of size, risk, solution/platform, client, and any other attribute that would cause this particular work to require a unique process flow as well as cause this work can be difficult to measure in comparison to other work types. What we Are trying to do is apply just enough structure to our demand to make measurements meaningful, while at the same time making sure that we can not go overboard and end up with something that is not maintainable in terms of robust analysis and metrics gathering.
metrics_work_Types_examples
Once work types have been defined, track the progression of work as it progresses through the software delivery lifecycle and track aggregate performance against these types
Now that we have our work types, we can track the start date and end dates of each work "ticket" (or package or feature or however you define individual units of work) never changes to a new process state (e.g. requirements >build). The date whenever a request for a particular unit of work is made, and the date that it arrived to the customer should also be tracked. I also recommend tracking whenever the work makes its way into input queue of a downstream process. Finally I also recommend tracking whenever an individual unit of work is blocked because of organizational impediments.
metrics_value_stream
An effective approach to tracking work daily is through the use of a physical kanban board as well as an electronic tool
Of course Kanban is not required for a measurable system of work, but it is an excellent way to enable everyday team members to both visualize their work and track work as it crosses different process "states". While the purpose of this post is not to explain kanban, in a nutshell kanban enables a pull system, where work is pulled into a particular process state only if there is capacity to handle it. Kanban allows knowledge workers to balance capacity with demand, make process policies explicit, and promote incremental improvement through the collection of state change metrics not to mention that it makes bottlenecks explicit.
metrics_kanbanTracking the state of each work unit and aggregating along each work type provides a rich and informative suite of metrics that can inform on both project and enterprise delivery health across a variety of software delivery contexts
The key metrics here that can inform on the evaluation of a healthy system of work is lead time, cycle time, and capacity load (more commonly known as Work in Progress or WIP). Leadtime lets us know how long a customer is waiting for a request to be completed, driving his number down leads to customer satisfaction and better business agility. Cycle time is a good indicator of how efficient delivery is, finally capacity load lets us know if our staff/workers are able to effectively start a piece of work and complete it before starting any new work. This last metric is an indicator of organizational maturity, collaboration, and effectiveness. Teams who are able to work with less inventory are fundamentally more effective than teams that are always working with larger inventories. Capacity is also a leading indicator of cycle time.
Other important metrics include value load, the ratio of work entering the system that creates new value (e.g. new features) versus work fixes existing value (e.g. defects or change requests), other metrics are briefly described below.
metric_overview

Tracking aggregate performance against differentiated work types is both effective and manageable
Once we have measured the performance of individual work units and aggregating them according to particular work types we can do some demand/supply analysis to baseline aggregate performance of particular work packages assigned to these work types. As an example, we could determine that a enhancement request for a new feature on an existing application takes 30 days or less the majority of the time. We can use these numbers to set up what is known as a Service Delivery Promise, where we promise our customer that we can complete a particular work unit for a particular work type within a particular period of time as long as total work is under a agreed upon capacity load. an example of this service delivery promise could be to complete an enhancement within 30 days 90% of the time, as long as there are no more than 30 enhancement requests passing throug system. this service delivery promise looks a lot like a service level agreement for an infrastructure style service. we are applying the same concept to delivery work. what makes this approach feasible is that all work units for particular work package type no longer contain a high degree of variability in terms of delivery effort. this means that new work package types will be identified fairly frequently during the initial stages of following this approach. new work package types will also be appropriate to support the business venturing into entirely new product lines , which may require new solutions and new approaches.
another approach is to set service delivery targets right away, before the system of work using a new approach has had a chance to run for a while. in this case historical analysis can help in figuring out what these targets are. often these historical do not exist , in this instance I recommend working with actual workers to come up with some baseline estimates for each of these types. Once performance targets have been identified, we now have a baseline for what normal system delivery targets could be as well as a baseline for further improvement. Creating good system delivery performance targets is always a bit of a chicken and egg proposition. My experience is that initial service-level targets as well as work type categorizations need to be really fleshed out through real work. While analysis is helpful, appropriate work package sizes, categorization types, and matching delivery performance targets will drastically change through the practical application of delivering real software.
matrix_Factory
tools like Statistical Process Control Charts can be used to help identify common and special cause variations and create opportunities for process improvement
now that we are tracking things like cycle time and lead time for individual units of work across particular work package types we can use Statistical Process Control (SPC) Charts to identify issues in the proces. SPC charts easily identify outliers in a measurement (cycle time, lead time, etc.) , we can then perform root cause analysis on these outliers to determine if the problem was “common cause” or “special cause”. Common cause are variations that result from a problem in our system of work. inappropriate process, bad software, too much governance, not enough governance, etc. are all examples of common cause variation. Special cause are not inherent in the process, should occur rarely, and seem unpredictable. someone becoming sick, getting hit by a truck, or an earthquake are all examples of special cause variation. examining these outliers for either type of variation allows us to make changes necessary to ensure that the particular issue that cause the variation in performance does not occur again. in this way we can further improve our service delivery promises as our average completion time continually improves.metrics_spc
Using Cumulative Flow, the Application Delivery group can determine how well they are limiting WIP and improving lead time
Cumulative Flow diagrams help to illustrate the amount of work-in-progress at each stage in the system . If the work is lowing smoothly, the bands should be smooth and their heights should be stable Lead time can be derived by scanning the diagram horizontally and it is evident that as WIP increases, lead time increases. This tool is useful for determining how well the Application Delivery group at maintaining their WIP limits
metrics_cumulative_flow

using this approach to create a measurable system of work is incredibly powerful, comments from my clients have been that they have been on a project before such a rich set of measurements allowing them to know exactly how the work was progressing. below is a sample dashboard that I have used in the past.
metrics_project_dashboard
.......

Saturday, November 27, 2010

Family Kanban

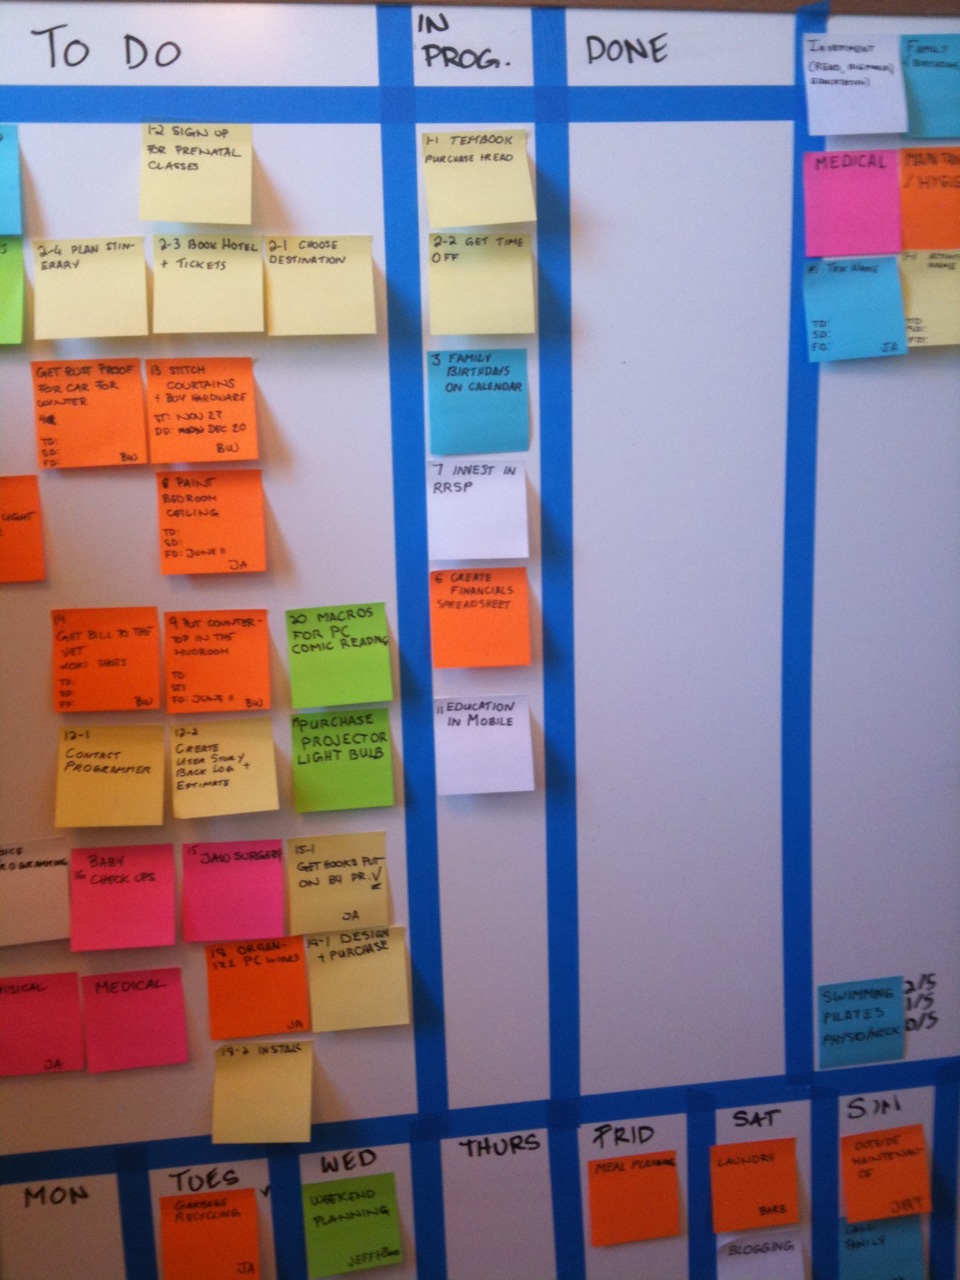
Over the last year I’ve had some great experiences applying kanban for my clients at both the strategic and tactical level. There is something inherently powerful about categorizing work into various homogeneous work types, creating a risk, size and value profile for each work type, and then attaching target performance ratings, work in progress limits and other policies to manage the flow of work.

I recently attended the Advanced Kanban Course by David J. Anderson and Associates, and David made a quick comment around how our locating work in progress to various work types/categories applies to real life as well. A certain amount of time should be spent on various "categories"; examples of categories could be investment/education, grooming/hygiene, entertainment, etc. Certain archetypes of people, do not balance these categories of life activities, and while these people may be deemed "successful", that might not always be the most pleasant people to be around, and certain gaps become painfully aware. David gave a great example of professional athletes, who often spend very little on "daily hygiene" (take a look at a professional athletes apartment) but will spend a lot more on their long-term investment categories of work.

With this in mind my wife and I (at my behest) decided to create our own "family" kanban. We’ve traded a couple of "lifestyle classes" which include the following:

  1. entertainment planning (including vacations)
  2. family related
  3. maintenance (both House and personal)
  4. medical
  5. investment (including education and long-term saving

We aren’t taking work in progress limits too seriously, but have set anything that’s in progress to approximately 9 items, we also have specific work items that we have assigned to specific days permanently, which will mark as done at the appropriate days.
We also don’t plan to be putting together a service-level targets like cycle time or failure in cake or anything like that. I just want to see if limiting working progress and visualizing work to help in terms of one’s personal as well as professional life.

.