Wednesday, May 23, 2012

Client Reviews: From Waterfall to Agile

We are currently transforming a large organization with 200+ people to adopt new agile behaviors. The transformation started off with identifying 3 pilot projects to be the first adopters of agile skills and techniques.

The 3 projects started their agile journey with creating a story map to organize and visualize their business requirements. The story mapping technique enabled the project teams to decompose their projects into features that can be managed independently. As a start, they used their current business requirements document and transformed it into a story map. The story map was then used as visual tool to drive discussions with business on feature creation and prioritization.

After decomposing the project into features, the teams created their Kanban boards with policies to manage the flow of work through the system. The teams’ set up regular cadence for standup meetings to provide updates on tickets, raise and resolve risks, issues, and blockers.

The new approach received positive feedback from business as a result of engaging them in more frequent discussions. Business is now working closely with project teams to get acquainted with the new tools and processes. Currently they have setup regular meetings with business to address business and IT perspectives on features and how they will be grouped into MMFs. The new processes and Kanban have provided project teams and business a collaborative and transparent approach to manage their projects.

Below are pictures from project Kanban boards and the team’s feedback on the new process and Kanban.

Pilot Project 1

  • “The story board has been instrumental in identifying gaps between the requirements and potential solution.”
  • "Although our project is still very early in the Kanban process we have found definite value in the visual and collaborative aspects of the model.”
  • “Having standups helps to ensure everyone on the team is familiar with the state of the project, what issues are currently open and also creates an opportunity for everyone to brainstorm and provide input when required.”
  • "Main challenges that I have seen are firstly trying to learn and pilot the model in a medium/high complexity project (learning curve) as well as adjusting everyone's views to how the project would be approached compared to a standard waterfall model.”
  • "Trying to retrofit a project that started as waterfall is challenging e.g. high level requirements doc (updated, revised) in progress when Kanban training started; developing project plan with business partner who had not yet been exposed to Kanban, and moving forward adapting to Kanban technique.”
  • "Learning and application happening at the same time (don't feel there is sufficient time allowed in the project timeline to 'practice' techniques/adjust our processes before putting it in front of the client; making mistakes as part of our learning can affect our credibility, especially in a culture that traditionally is not failure/mistake-tolerant.”


Pilot Project 2


  • “One could easily understand the work flow and identify the bottleneck to re-distribute the work load.”
  • "It makes work more interesting and more transparent.”
  • “It also helps me to find where is my position in this project and the relation between my tasks and others, and who will be affected if the task cannot be delivered on time.”
  • “The most challenging part is defining meaningful tasks (fine-grained) or feature sets and reduce the coupling (dependency) between tasks, which is the key part to make the whole workflow goes smoothly.”
  • “Switching to Kanban in mid project hasn't been easy. some overhead was encountered  getting everyone up to speed but project timelines weren't changed”


Pilot Project 3
  • “The daily standups promote communication between my peers.”
  • “Helpful to identify road blocks and the opportunity to resolve more quickly.”
  • “Using Kanban, we can trace the project activities, and find the bottleneck (blocker) in the different phases.”
  • “Business stakeholders wanting to drive Kanban activities before they are fully understood. Often the business PM is not clear and causes confusion.”
  • “Clarify the role and responsibilities of the Kanban Champion in relation to the Project, how they interact with business - this is not clear and is causing confusion.”
  • I feel that we have a challenge to get blocker removed quickly and efficiently, and define the delivery timeline/milestone for each MMF.”

Thursday, May 10, 2012

Integrating Story Mapping with Kanban

Piloting projects on Kanban requires projects team to re-think the old way of consuming requirements and move towards a more structured approach. As a start, large scale projects must be decomposed into features that can be managed independently. In a lot of organizations we find requirements in the form of a business requirements document. Usually:
  •        The requirements are not organized to show the value provided from a user perspective
  •       There is no priority assigned to the requirements with respect to the other requirements
  •       Endless discussions with business to finalize and “lock” the scope of the project

We have had great experience using story mapping to help teams address the challenges that often find in a typical business requirement document. We have been integrating story mapping with Kanban to enable teams to start thinking in an agile approach from day 1.


1- Creating features is a collaborative exercise where the project team and business stakeholders list and organize the features in a sequence of events that deliver value from a user perspective.


2- For each of the activities, the features are prioritized with respect to each other.


After the features are prioritized, the team can now start creating MMFs by slicing the map horizontally.


3-     The prioritized features and MMFs from the story map can then be used to populate the Kanban board. 


The story mapping techniques enables teams to see the bigger picture and the scope of the project. As a result, this technique helps project teams to think about features and releases from a holistic project perspective.


Sunday, May 6, 2012

My Definition of a Minimum Viable Change - Lean Startup For Change

I've submitted numerous posts on Lean Startup 4 change. Time to put a stake in the ground and define exactly what I mean by a Minimum Viable Change.

To properly understand how to define a Minimum Viable Change we need to understand what we are trying to measure...


yes you...

Therefore I define a Minimum Viable Change as follows...


Please note that this post does not endorse the use of heroics on projects of any kind...


Thursday, May 3, 2012

The Gamification of A Kanban IT Transformation

My last post discussed how I and my team were using a transformation participation engine to provide our change team with metrics necessary to support validated learning for our change effort.  Aside from enabling a Lean Startup approach for our change effort, we also plan to use the data set captured  within our engine to Gamify our transformation.


Different transformation  campaigns (eg Kanban, Agile, Dedicated Quality Office, etc)  have been broken into explicit learning tracks. Each learning track has been further refined into specific skills that we hope our clients acquire as part of the transformation. We are tracking our progress (note NOT progress of folks who are learning) as the number of staff and managers who acquire specific skills.


In order to add an element of Gamification to the transformation, we plan to introduce the notion of behavior / change points. Skills are acquired through completion of explicit behaviors. Each behavior when exhibited provides a specified amount of points. 

The gamification aspect comes in because behaviors can only be acquired from folks who have 
A) already acquired the skill that the behavior belongs to
B) have a point reservoir equal to the behaviour being acquired.

Behaviors are acquired by "transferring points" from on person to another. This has some interesting implications.
1) you must find a mentor to acquire a skill, it's not up to the change team or managers to validate your progress, it's a pure peer system
2) you can only give your points away once, after that the pupil must become a teacher or the system dies
3) giving someone credit prematurely is limited because both you and your mentor will look foolish if you are called out.

Our first Minimum Viable Change using this approach will be to setup a manual Leaderboard outside of a Kanban based standup, and measure wether there is desired change in behavior. Or wether people throw eggs at us...


Depending on success, we also plan to prototype some character sheets, periodically updated manually by our team.


If Gamification proves to be a hit than we will figure out how to automate all this stuff ...


Wednesday, April 25, 2012

Implementing Minimum Viable Changes As Part of a Lean Startup For Change Approach

In my last post I described how we measured Minimum Viable Changes (MVC) for our Lean Startup Enabled Kanban change initiative. In this post I will describe the exact process we used define, implement and measure those MVCs.


image

In order for our approach to provide learning at the pace we required we needed to be able to define Minimum Viable Changes that we could complete in a matter of weeks or days. We did this by breaking up our strategies into one or more transformation adoption "campaigns". Each campaign was differentiated in terms of underlying adoption approach used, a strategy it supported, or any the content being adopted.


image


MVCs were then designed to validate assumptions contained within a particular campaign. We needed to quickly validate if the approach behind a particular campaign could change people's behavior, and help them acquire new and useful skills at the rate required for success.

Each MVC was labeled according to a descriptive name along with one specific assumption that it was designed to validate. Each MVC contained an explicit hypothesis, along with details on how to measure the accuracy of that hypothesis.


 image


Every MVC followed a similar measurement approach. Each MVC targeted a specific set of skills taken from the Transformation Participation Engine mentioned in the previous section. The value of each MVC was determined in terms of increased number of individuals acquiring new skills. Assumptions could then be validated by measuring actual changes in behavior, and determining if the adoption approach underlying the campaign with sound.

An example of this approach is the Kanban strategy, which was categorized into a number of campaigns. The Visualize As Is Work campaign was dedicated to visualizing current state processes, and gradually implementing WIP limits, policies and other components. There was no inclusion of other agile practices. An example of a MVC implemented for the Visualize As Is Work campaign was the setup of Functional Department Kanban Boards.

On the other hand, the Kanban/Agile Pilots campaign used a much more aggressive approach, mixing Kanban and Agile practices, such as story based development, cross functional teams, planning poker, etc. An example of the MVC implemented for this campaign was dedicated coaching and training of story mapping.

Other campaigns included a Kanban self-starter program allowing everyday staff to run their own Kanban initiatives, a hiring campaign to recruit dedicated Lean/Agile coaches, and a gamification framework that would render individuals progress in skills and behavior in a role-playing game style character sheet and leaderboard.


image

Using Kanban to track validated learning, while supporting a Kanban transformation

Of course to track the progress of our organizational transformation the change team used a Kanban system.  During the first 3 months of this engagement our Lean Startup Kanban system changed 5 times. Our end product was much simpler than previous incarnations, and has provided us excellent support for a validated learning change approach.

The backlog consisted of numerous campaigns, each campaign being associated with a set of MVCs that could validate the assumptions contained within each campaign. The priority of a particular MVC was represented by placing these MVCs from left to right on the backlog. 

MVCs were sized so that lead time would be between 1 and 3 weeks. During the preparation phase, metrics used to measure a specific hypothesis was defined, and the exact impact/commitment from the targeted set of clients was also specified and communicated. 

MVCs were then introduced to a subset of the organization known as a cohort. The introduction state involved initial coaching and training, hands-on workshop facilitation and other activities. Once the client was deemed to be somewhat independently operating with the new skills introduced, we moved the MVC to the watch state. 

Watching consisted of observing the behavior of our customers, and measuring specific behavior according to the Transformation Participation Engine. Once our customers had been observed for a suitable amount of time, we then measured the MVC, and determined if our outcomes matched our hypothesis. 
At first it was difficult to determine when to move a MVC from watch to measure.  We soon came up with a simple rule. A MVC could be moved as soon as someone from our team felt that a campaign required a change in tactics. This called for immediate action to measure the MVC that was currently in-flight, and introduce a new MVC to validate the modified approach. Often these observations preceded our measurements, we were measuring people's behavior, behavior that we had to manually observe. As a result our observation and measurement operated in tandem with each other.

Once a week we held team retrospectives, at that point we we reviewed all measured MVCs, discussed the outcomes and moved the MVC to the appropriate pivot or pursue lane depending on the results of the discussion.  The decision to pivot or pursue was also typically made at these retrospectives, once we had an opportunity to review a batch of MVCs.

Tuesday, April 24, 2012

Introducing the Transformation Participation Engine

Update: This part of the method is no longer being practiced by our team. We still feel that having a clear learning path for individuals is important, but it must be voluntary, transparent, and based on self assessment. It must also be pull based, where participant actually ask to be part of the system. Stay tuned for future updates.I am currently knee-deep in another large-scale IT organizational transformation. Again Kanban is a critical enabler, as are a mixture of agile methods. What makes this transformation different is our team's decision to manage the change initiative using a modified form of lean startup methods.
The following definition of a startup from Eric Ries Lean Startup book particularly inspired us...
a human institution designed to deliver a new product or service under conditions of extreme uncertainty
By this definition, an enterprise change initiative could be deemed a startup, one that could take advantage of Lean Startup techniques.

image

We quickly came up with an approach to guide our change initiative based on the Lean Startup method. We called it the Lean Startup Change Approach :-). What became quickly obvious to us, is that it was not apparent on what we were supposed to be measuring.

Measuring the things that matter for a change initiative


This turned outTo be more challenging than expected.  At first we tried to be overly be clever, and come up with experiments that would validate the performance benefits of Agile and Kanban practices. This exercise realistically would take many months, if not years, to complete.  Our team did not have the benefit to dedicate that much time.

After a significant amount of thinking we we focused our efforts on figuringOut how to measure behavioral change and capability of the organization to adopt different methods, as opposed to measuring the methods themselves.

Any validated learning effort should focus on assessing the areas of highest risk first. In our case we needed to be able to effectively change the working habits and thinking culture of our clients before our involvement in the change effort came to an end. Our job was to make sure that our clients were positioned for success once we left.

The Transformation Participation Engine


With this in mind we created a "Transformation Participation Engine" framework. The objective was to track and visualize the progress of adoption for individual staff on the journey towards lean thinking. Minimum viable changes (MVC) could then be developed specifically to target measurable changes in a subset of the organization.

We defined such a system by deconstructing the objectives of our change initiative into a set of fine-grained target behaviors. We then grouped those behaviors into specific skills, grouped those skills into tracks, and finally grouped those skills into strategies. Below is a simple diagram showing the components of the Transformation Participation Engine, along with a sample of each component in brackets.

image

Once we had a robust repository of behavior and skills, we associated each skill with an achievement rating. The Achievement ratings for skills were then used to calculate an individual's overall progress in terms of participation in the transformation. In our first iteration of the transformation participation framework we followed a very simple calculation algorithm. Achieving a rating from a single skill would be enough to promote an individual's overall progress to that rating. We anticipate using a more complex algorithm as we continue to use this framework.

image


Example: the Kanban category is divided into various tracks including Operate, Invent, Manage and Own. The Invent track contains a number of skills, including the Design skill. In order for someone to successfully achieve this skill, he or she would need to demonstrate evidence of a specific set of behaviors, one of which is building a Kanban system from scratch.
Bob completes the Design skill, which has an achievement level of Prowess, his overall progress is therefore Prowess


Using Kanban to visualize transformation participation


We defined a Kanban system to visualize and measure the learning/participation progress of individual staff, managers and executives using this framework. Each individual was represented as a set of work tickets within a Transformation Participation Kanban system.
A separate swim lane was used to track each FTEs overall progress. Each employee with the organization would have exactly one ticket on the “overall progress” swim lane

image

A separate area of the Kanban system was used to visualize an individual’s progress in various skills. An employee ticket was cloned for each skill that he/she was trying to complete. These "skill" tickets would progress through the skills track according to skills completed. As skills were completed, they would provide the employee with an "achievement rating".

The employee work ticket within the “overall progress” swim lane would move to the appropriate state according to the achievement rating received by completing particular skills.
With this system in place we were able to both track and project the rate that the organization would be able to adopt new methods. This became our primary method of communicating status throughout the transformation.

image


Once we had this measurement system in place, our work turned towards determining as quickly as possible whether any of our transformation methods would support the projected velocity of change. We then needed to design MVCs to specifically evaluate these assumptions. In essence, we elected to focus exclusively on "growth assumptions" for the immediate time being.

I'll talk about how we designed our various MVCs, and providing examples in future posts.
Technorati Tags: ,,,

Saturday, April 14, 2012

The Futility of Tracking Individuals Time

An inordinate amount of economic resources are spent on managing people's time. Professional Services, IT, Design Agencies are typical examples of organizations that ask their staff to track every task they do, the type of the ask, the client the task was for, etc., all down to the hour, or minute, depending on where you work.

The rational for doing this seem perfectly reasonable, even if the outcomes do not.

Chiefly, business owners want to know if they are charging the right price for services rendered to clients. The need to track effort is a primary objective. Supposedly this helps managers optimize efficiency.

Tracking time is also cited as a way to prevent abuse at work. Time management is supposed to protect workers from being forced to work unreasonable hours. It is also is touted as a way to keep workers honest, preventing them from spending to much time googling, or facebooking, or other kinds of goofing off.

While the objectives are rational, the ability of management to ignore the obvious dysfunctions of time management is not.

Whenever time tracking is used to prevent abuse, falsification of data is the result.

Project Managers will prevent workers from tracking after hours work if it affects their budget, regardless of exhortations from senior leadership. This is especially true in professional service and consulting firms.

Workers will also enter time according to the expectations of their management, implicit or otherwise. No one wants to be flagged as a bad performer.

Even when discounting abuse, time entry is notoriously inaccurate, most workers have trouble remembering exactly what they did down to the hour for an entire week. Again, time gets entered according to management expectation, rather than reality.

The really insidious aspect of time management is that it is measuring the wrong thing. It emphasizes an inward perspective where cost is king.

Success in a customer experience economy requires an external perspective, one focused on getting a handle on the creation of customer value.

On first look, this is a more involved exercise than tracking individuals time.

Measuring customer value requires a deeper understanding of the types of goods and services you offer to your customer. This allows you to look at metrics like throughput, the time it takes to create customer value, and how often you deliver value without incurring customer complaints.

These are the metrics that matter to your customer, not the exact time spent by every FTE. Cost can still be measured, but by approximation, which is more than good enough for most situations.

Simply take the total burn rate to produce a product or service and divide it by the throughput. Effort across multiple services gets amortized across the portfolio.


- Posted using BlogPress from my iPad

Tuesday, March 20, 2012

Kanban Adoption Approach

We have been running large transformation projects for the last several years helping organizations to become more agile in their delivery.
A typical approach one often encounters is to select a pilot project, run the pilot and then move onto another pilot.
Based on our experience, we recognize two major issues with the project pilot oriented approach:
1- People already are participating on multiple projects. This causes multitasking that is not captured by the Kanban system. This makes the pilot very limited in terms of value.
2- Organizations often select a project that is just starting. These projects can take as much as 3-6 months to get out of the conception phase. This makes seeing any real momentum impossible.
As a result, we are trying a different approach, one that takes an organization/ team perspective. We hope to eliminate some of the challenges inherent in a project based approach.
We start with a group of early adopters that are working on inflight projects and visualize all of their work.

We are adopting based on “delivery nodes”. We view the organization as a network of interacting units that provide business value. We select a subset of the organization that uses a single technology solution. We get the team onboard with Kanban and try to stabilize their work.
As we are getting an understanding of other work surrounding this delivery node, we can decide who to adopt next. The adjacent node is determined by looking at both risk and value. We want to promote flow for all work under the current scope of adoption while simultaneously expanding our scope.
This approach will allow adoption to proceed using a continuous approach, maximizing flow throughout the organization connecting customers, suppliers, and peers in each subsequent wave.

Implementing basic Kanban throughout the organization allows further insight into the tools/ skills/ methodologies that can be adopted to improve the teams’ capabilities. Additional capabilities, such as feature decomposition and test driven development can be developed as incremental change units and rolled out through the organization where applicable.
We created a roll out plan to have large adoption waves on-boarding 50-60 FTE's per month. After month 2, the basic Kanban implementation is reduced to half to allow the organization to adapt to the new work systems and to start implementing the incremental units of change.


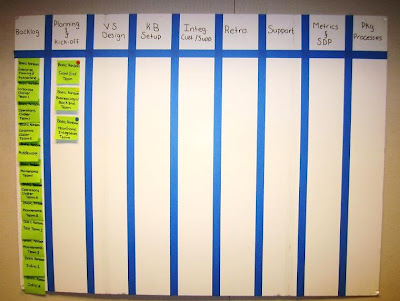
A Kanban board is created to model the rollout plan. The backlog represents the teams that will be trained on the basic Kanban and the incremental units of change.

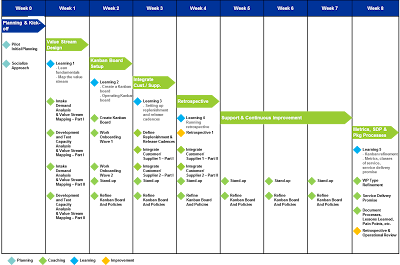
The adoption wave is a 9 week effort program. Each of the adoption waves will start with a week of Planning & Kick-off and then followed by an 8 week training and coaching program. During the 8 week period there are 6 major learning, workshop and support activities that are essential for a successful implementation.

A Kanban board is developed to model the training material to track the progress of each of the teams through the training program.

We kicked-off training sessions with multiple teams. In a later blog post we will review our initial approach and share our experience on onboarding the teams to their first Kanban board.


Saturday, March 10, 2012

Lean Startup For Change: Bootstrapping an Enterprise Kanban Transformation with Lean Startup Methods


By now many are familiar with the concept of the LeanStartup, and the methods pioneered by Eric Ries and others. In a nutshell the LeanStartup approach helps human institutions create value in a sustainable way in highly volatile/uncertain environments. This technique has become the de facto standard for young, savvy technically minded entrepreneurs working in innovative new organizations.

But thinking that the LeanStartup method just applies to the folks in Silicon Valley misses the point of how powerful these techniques are.

Increasingly all manner of organizations, institutions and enterprises are being forced to compete in highly uncertain markets. This means that LeanStartup applies to a wide variety of domains. One such domain is large-scale enterprise transformations.

I have spent the last several years of my career dedicated to IT transformations, helping clients to improve the performance of knowledge workers dedicated to building business applications. I have specialized in using agile and lean techniques, lately putting a real focus on capital K. Kanban, invented and made famous by David J Anderson.

Recently, our team has elected to enhance our transformation approach with LeanStartup. While this is still an evolving approach, I’d like to share our current progress.


Breaking down Change into Increments of Learning
Most change management approaches rely on making a huge number of assumptions about the organization, and impact of specific changes. Kanban provides a more incremental approach to these changes, but still contains a number of assumptions around how people react to certain components of the framework.


The LeanStartup approach recommends breaking product delivery into a set of Minimum Viable Products (MVP). Each MVP is built for purpose to support learning. The really interesting part of the MVP approach, is that you often don’t have to build anything to learn something about the viability of your product.

In our approach we are breaking up all of the assumptions in our transformation into a set of Minimum Viable Changes, in effect we have decomposed our transformation into the smallest possible units, laid out our underlying assumptions, and then backed up each assumption with a hypothesis and a set of graduated metrics to support that hypothesis.

Defining Target Behaviors Using Measurable Hypotheses
Components of the transformation have to either lead to improved performance (value hypotheses) or facilitate adoption (growth hypotheses). Again rather than relying on assumptions, the transformation vision is decomposed into specific strategies, and the strategies are further broken up into behavioral hypotheses. These hypotheses are tested through the creation and implementation of various MVCs. This approach is allowing us to gather data around whether to change our tactics, while continuing to pursue our overall strategy, or whether to make a major pivot, and make major changes to our overall strategy.


Measuring Specific Hypotheses
MVCs test specific behavioral hypotheses, in our approach we are using classic cohort testing recommended by the LeanStartup approach. Targeting a single MVC against multiple cohorts, or split testing against different cohorts.


We have structured Kanban, and other lean components into a set of graduated behaviors. And then designed appropriate MVC to test these behaviors. We are also currently in the process of extending this framework to cover other agile process components as well.


Here is a sampling of hypothesis with some ideas on how we plan to measure  the accuracy of our assumptions. These metrics are refined depending on the MVC we design to test the hypothesis.


We are only a couple of months into the process, but some interesting observations have already come to light...

  • we are adapting ALOT faster, no pivots necessary yet, but we are incrementally adjusting our tactics every couple of days
  • our MVCs are getting much smaller, and we are just getting ready to rip down our transformation Kanban board to better reflect the MVC approach as we get more comfortable with it
  • cohort testing is revealing a competitive streak with our coaches, causing us to really maximize client participation (one of our key metrics), we are in effect gamifying the transformation
Stay tuned, we will continue to share our progress...


..

Thursday, February 23, 2012

Lean Thinking Tools for Improving Your Portfolio Planning and Prioritization Process

We just started an IT Transformation for a new client that is looking to fundamentally change the way they deliver IT services and application development. As part of the transformation we are helping the organization improve their portfolio planning and prioritization process to provide greater transparency, flexibility and control (yes control and agile does go together). Whenever we work with clients in this area, the first step we take is help them break down their old mental model of portfolio management and take a fresh perspective. To do this we introduce four thinking tools to help them wrap their heads around the new concepts. The goal of the four thinking tools is to help organizations look at planning and prioritization as an economic bargaining system.

Thinking Tool 1: Three level planning approach controlled by cadences


The first tool is to stop looking at portfolio planning and prioritization as a one time annual budgeting process and instead move towards a frequent multi-level planning system for portfolio management. Each level of planning should have well-defined units of work, cadence, and a form of currency (more on that later). The specific goals of each level are:

Strategic Planning:
  • Identify ideas to realize strategic business objectives
  • Set allocation based on LOB / Program / Work Type
  • Longer Cadence, example quarterly
Project Planning: 
  • Idea analysis and project planning
  • Define projects in terms of business valued features based on a high-level solution
  • Medium Cadence, example monthly
Operational Planning:
  • Project work intake with frequent work replenishment for solution delivery
  • Dedicated intake channel for emergencies, small enhancements and bug fixes
  • Short Cadence, example bi-weekly
Thinking Tool 2: Breaking projects into minimal releases and business valued features


Based on Thinking Tool 1, if the organization is able to establish more frequent strategic planning cycles (e.g. quarterly) than this encourages projects to be broken down into smaller chunks that can fit into those cycles. This allows IT to work more frequently with the business to understand what the high value features are and get to quick wins faster. At the same time this also provides greater transparency of progress into budget spent vs budget realized in terms of real value (i.e. a potentially shippable system).

Thinking Tool 3: Planning informed by capacity in terms of throughput to level demand

One of the challenges with traditional planning approaches is that capacity is not used to inform the planning process. To build an effective planning and prioritization process the organization needs to understand capacity in terms of throughput (how much value can I deliver within x amount of time) and level demand based on available capacity. What we often see broken with traditional processes is budget being the only input into the planning process and that is typically not the "bottleneck" or scare resource in the organization. Money is abundant, time is not which leads to the end of year madness many organizations fire fight their way through.

Thinking Tool 4: Establishing currency to represent scarce resources provides a mechanism to facilitate exchange of value to promote liquidity and flexibility

The final piece to the puzzle is establishing a common unit of currency based on scarcity. Instead of throwing money at the problem, the organization starts looking at their delivery capabilities as system of work that has real constraints (i.e. time). The unit of currency we alluded to earlier in Thinking Tool 3, is throughput which represents work/value in terms of time. The currency is then limited based on scarcity which is represented as work-in-progress (WIP) limit that controls the backlog and queues that work fits into.

By understanding these four thinking tools they provide an organization with the foundations for establishing a fast feedback portfolio system managed by multi-level planning with cadences, defining projects into smaller increments of value, balancing demand based on throughput, and planning and prioritizing based on a common unit of currency that represents scarcity.

In a later post, I'll share a set of planning and prioritization patterns we use to implement these concepts.

Using the Business Model Canvas in an IT Transformation

The Context
Our client is initiating an end to end transformation of both business processes and IT systems used to deliver services to its customers. The goal of this transformation is to enhance the ability of their IT Organization to execute on the delivery of new applications, changes to existing applications, and support/maintenance activities. The organization also requires enhanced capability to better execute on delivery strategy, governance, and standards. This transformation will enable our client to better meet the demands of its clients by increasing throughput and quality, while simultaneously reducing delivery lead time.

As part of our initial discussions with directors and managers we decided that the business model canvas can be effectively applied to describe the client’s current software and services delivery model. Based on insights from Directors and Managers, we filled up a 6 x 8ft canvas with sticky note insights.

What is the Business Model Canvas?
The business model canvas is a tool that helps you describe, design and visualize a business model. The canvas helps an organization describe how they intend to deliver value by focusing on 9 building blocks:
  1. Customer Segments
  2. Value Proposition
  3. Channels
  4. Customer Relationships
  5. Revenue Streams
  6. Key Resources
  7. Key Activities
  8. Key Partners
  9. Cost Structure
It is not enough to look at the building blocks as a checklist – they are assembled in the canvas below to help visualize the relationship and interactions between them:
The building blocks focus on a set of key questions that help collaborators capture their insights and facts about the current or target model. These insights and facts are captured on sticky notes so that they are never permanently fixed to the canvas. We adapted the original canvas from the book, Business Model Generation, to suit our unique need.

If you want to learn more about this tool, you can purchase the book, Business Model Generation. There is a 72 page sampler of the book at http://bit.ly/jXCPHQ.


The Custom Canvas
The client environment is quite different from the examples and cases available in the book so we modified the building blocks to suit our particular needs. After several iterations we landed on the following building blocks:
These building blocks were used to create a 6 x 8 foot canvas on a wall in our war room. We had multiple stakeholders from the client team join our business model canvas workshops to capture their insights on some key questions to help us populate the canvas:
  1. Who are your customers? Which customers use which services? How is demand communicated to your department? How does intake work?
  2. What vendors do you currently work with- both internal and external to your organization? How do they contribute to delivering value?  How do you coordinate to deliver?
  3. How do you measure performance? What does your performance look like for the various kinds of work that your department does?
  4. What types of tools, processes, and accelerators do you leverage to add value? Which ones are you thinking of using in the future?
  5. What do you believe are the major risks or issues that interfere with delivering business value? What counter measures have been attempted to solve these problems or mitigate these risks?
As we conducted the sessions, we started to identify 3 major types of insight. The sticky notes were tagged with a colour corresponding to the types below:
  1. Pain Point (red) – something the client wants to change because it is not working well
  2. Target State (blue) – something the client wants to have because it will help to deliver more value to the customer
  3. No Change (green) – something that is working well and do not want to change
We not only used sticky notes, but also modeled using blank sheets of paper and affixed it to the canvas with painters tape. After the first wave of workshops, we communicated an open-door policy. Anyone can walk in and start adding things to the canvas with our help. Below is a photo of the results:

We ended up with a canvas that helped us get an understanding of the client’s delivery model, pain points, and things that are working well. We also started to look to the target state with many suggestions for positive change. This canvas is in a constant state of flux and changes daily capturing thoughts and facts as we learn and discover. Finally, right at the top of our canvas, we wrote the client’s vision on a sheet of paper to anchor the discussion overall.

Sunday, February 12, 2012

You Can't Trust Your Workers Metrics Unless Your Workers Trust You


It's common to place a lot of faith in the power of what metrics can tell us. I've met more than one executive who romanticized about some kind of super dashboard that could pinpoint all the risks and issues, allowing them to base key decisions largely on the data they are seeing.

This could be a desirable target state, if you are doing something simple, like delivering pizzas.

In today's customer experience economy many of us are involved in something a little bit more complex. We are more likely to engage in tacit activities, activities that require analysis, learning, collaboration and on-the-fly synchronization. Chances are, we are engaged in knowledge work.

A profound truth that many fail to appreciate is that knowledge work is inherently variable. Each request for a service or product is always a little bit (or a lot) different from the last one. And you can't remove this variability from the equation. Doing so will remove the work of its value, the work will no longer be something new. Robots could do it.

This makes getting meaningful metrics somewhat problematic, comparing one unit of work to another will always require some creativity.

What this means is you can't measure knowledge work effectively unless your knowledge workers want you to.

Measuring knowledge work means measuring abstractions of the work your knowledge workers do. A trial and error exercise is required to come up with something meaningful. You need commitment to get to a stable performance baseline.

Even more so you'll need courage. Metrics for knowledge work are extremely easy to game, and being transparent about bad data is something very few organizations do well.

And it's not a one-time thing, the approach you take to measuring whatever it is you want to measure will always be little bit wrong. The context that knowledge work takes place in is always changing.


If your workers don't trust why these metrics are being used, you won't have accurate data. You won't have the insight required to know what to do with that data. And you will make bad decisions in the name of that data.

Metrics can be a good thing. But trust comes first.

Wednesday, February 8, 2012

Kanban 101


Kanban is a less disruptive path to a higher state of organizational maturity.


Kanban inspires a culture, where everyday staff, focus on incremental improvements. This type of culture ensures that an organization can make changes that are tolerable, both right-sized and at the right pace. Over time, organizational maturity grows, and with it, higher performing teams.

The incremental change approach is vastly different from a “Big Bang” approach. A Big Bang approach typically impacts performance to a level where the change initiative is at significant risk of failure. As performance drops significantly, several challenges arise: low employee morale, loss of trust among executive sponsors, or simply, the organization cuts their losses and resorts to the old way of doing things.

Limit the amount of work entering the system.


By limiting the amount of work that enters an organization’s delivery center (e.g. enterprise software delivery), the organization can focus on continuous improvement through its workflow among teams and value stream overall. A domino effect results:

  1. Reduce Work In Progress (WIP) Limits – Lowering the level of work in progress (inventory) has a significant, positive impact on average completion time of individual work items
  2. Reduce Task Switching – As an individual item is completed faster, the need for wasteful task switching between work items is reduced
  3. Reduce Cycle Time – Lower average cycle time means shorter lead time for individual work items
  4. Increase Feedback - Quick turnaround time also means that quality checks are done with a fresh concept”, and the opportunity for error decreases
  5. Increase Quality - Increased feedback improves the quality of the final result
  6. Increase Team Maturity - Increased Quality leads to an increase in overall team maturity and performance, quicker lead time results, teams are further able to lower the levels of work in progress

Kanban is an approach to visually represent a unit of value.


The Kanban Approach:

  • Visualize the work – a visible display of moving work to completion becomes a powerful reward
  • Pull work based on WIP limits – to create a predictable workflow
  • Empower staff to improve processes – simple, visually represented measurements of progress become intrinsic motivators to do the right thing
How does it work?


  • Management and staff have a common understanding
  • Bottlenecks, issues, and defects are easy to spot
  • Explicit mechanisms for root cause analysis and continual improvement
  • Demand is limited, fostering focus, early delivery of value, and making bottlenecks obvious
  • Defect correction focuses on the source of the defect, not just the defect itself
Work Policies continually evolve as the organization matures.


Organizations build policies and modify them as they are incrementally changed through improvement discussions. Teams may define policies at different levels of detail such as work policies (at the workflow level) or team policies that apply to the team as a whole. For example, a team policy is conducting a daily stand-up at 10AM every day. A workflow policy may define entry and exit criteria for a given phase in the workflow.

Kanban allows teams, managers, and the organizations as a whole to become better at measuring.

Kanban provides the tools to predict delivery time, reduce risk, and analyze problems using quantitative methods. Tools such as statistical process control charts, and cumulative flow diagrams will provide robust metrics managers yearn to discover.

If you would like to learn more, visit the links below:
Limited WIP Society - http://www.limitedwipsociety.org/
David J Anderson & Associates - http://agilemanagement.net/
NetObjectives - http://www.netobjectives.com/
Lean Software and Systems Conference - http://lssc12.leanssc.org/