One of the first things we did was start to analyze the requirements work that had been done to date. We pulled requirements, features, business rules, etc. from these various artifacts and organized them using a story map. The story map covered the majority of an entire wall, using flip charts and sticky notes, we created a hierarchy that started at the top with business goals, and the bottom level being a collection of requirements line items from the various requirements documents. This approach allowed us to add sequencing, structure, and context to individual requirements line items, supporting our ability to do downstream analysis on collections of requirements organized by stories represented in the map.
Fans of Alastair Cockburn’s work will notice that this story map bears a striking resemblance to the use case hierarchy described in his use case books, it is basically identical, but we use the term story map as it has a more "agile" connotation.
What interesting to note is that early on in this process we relied exclusively on these requirements artifacts to help build the map, but as the team is gaining more and more confidence, we are finding that we are building the map from scratch, and then going through the requirements artifacts just to make sure that we didn’t do anything that was inherently in conflict with these requirements.
As we were creating the story map, we annotated stories within the map with issues such as conflicts, questions or obvious errors, as well as things like pre-existing services, specific systems, and the like. Different colored stickies represented different kinds of data, what’s interesting is how visually rich story map has become over time.
once we understood enough of the story map to understand the business problem, we also started doing "minimal system analysis" on individual items within the story map, we wanted to get a order of magnitude understanding of what systems had to speak to each other as a result of implementing a specific user story. We were especially concerned if a system change meant that a piece of work would have to be allocated to a different team. This system allocation analysis also help us understand complexity of the potential story within the map.
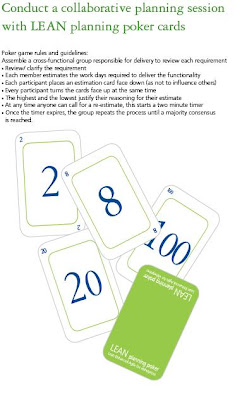
Once we felt like we started to get a good handle on what the story map should look like, we defined the overall objectives, scope, and purpose of a number of Minimum Marketable Features. We then "walked the story map" to create workable, user stories for the minimum marketable features that we wanted the delivery team to start implementing. In effect, we went through the bottom layers of the story map, determined if a particular story map should be part of the next Minimum Marketable Feature, broke the story up into a smaller unit of work if necessary, and then estimated it using planning poker (made famous by Michael Cohn).
As a rule, we urged the group not to take the estimation too seriously (which was challenging :-)), what was more important in our minds was the useful conversation, ad hoc modeling and dialogue that was generated as a result of the estimation itself. We actually hope to be moving towards a more kanban style measurement approach in the future where tracking average cycle time will trump estimation, but have found the planning poker approach invaluable as a way of encouraging good dialogue.
At this point we are able to start involving developers, architects, and testers more intimately. We grouped these resources into a "story analysis" work cell responsible for doing "just enough" analysis to ensure that it was ready for delivery. Story analysis included Class Responsibility Cards (check out a great overview by Scott Ambler), Behavior Driven Development style scenarios and acceptance criteria, user interface modeling, and external interfaces for other systems. We also reserve the right to "perform any other modeling" as necessary to help prepare a work ticket as "development ready".
In parallel with doing this analysis, we worked with the team to come up with a preliminary value stream and associated Kanban (invented and made popular by David J. Anderson) to track not only the operation of the agile PMO, but also the work done by the delivery and testing teams.
we included the majority of team members in this process, including developers and testers (as opposed to just their bosses who were involved up to this point). we have also been careful to point out that this is just a preliminary kanban being suggested, and that it would likely have major changes in the next several weeks.
As you can see below, the team elected for a three tier value stream & kanban. While I did stress that many not be that right level of complexity to start off for a Kanban board, I have to say I am working with an incredibly intelligent and sophisticated group, and they were able to articulate a rationale for wanting the three levels. I will go into another post discussing exactly how the kanban and value stream is intended to work, but want to give it some time to actually run before I do so :-).
Kanban is also being used to track the actual work of the agile PMO. We have graduated to (after several weeks) dedicated some lines for questions that need to be answered, explicit modeling activities, analysis with external parties, infrastructure and tooling, and internal design/analysis/planning sessions.
Last I looked into this group, members were individually completing both the enterprise and story analysis function on their own. I look forward to watching this flourish and continue to coach what has so far been a very rewarding and exciting experience.


No comments:
Post a Comment